

Infographics
An AI Infographic Generator That Works From Your Article
Write & Grow has an AI infographic generator on the draft page of every article. Pick a template, and the AI fills it from the article or one section of it, using only what the article says. You edit it with a live preview, and it goes into the post under the heading you choose.
This makes infographics from articles written or updated in Write & Grow. It is not a standalone design tool, and there is no blank canvas to draw on.
From Article to Infographic in Five Steps
Open a draft and choose Add infographic. Nothing is uploaded until you add it.
Choose a template
Fifteen layouts, from a step-by-step process to a comparison table. Each one says what it suits.
Choose what it is drawn from
The whole article, placed after the introduction, or one section, placed under that heading. Add notes for the AI if you like, such as “keep it to five steps”.
Let the AI fill it, or start empty
The AI fills every field from the text you chose, within each field’s length limit. Or start empty and type it yourself.
Edit with a live preview
Change any line and see the result at once. Pick one of six colours.
Add it to the article
The infographic is drawn, uploaded to the site’s media library and placed in the article with alt text that lists what it says.
Only What the Article Says
A wrong number on an infographic is easy to miss and hard to take back once it is shared.
What the AI is held to
It is given the article’s text and told to use only its facts, names and numbers.
- Every number on the infographic is compared with the article, including ones you type
- A number the article doesn’t give is listed as “Not in the article” for you to check or take out
- The sources line is kept to the sources of numbers shown on it
- A table row the article doesn’t cover shows a dash, not a guess
What stays in your hands
The AI fills in fields; the template draws them. Nothing it writes becomes page code.
- Edit, add or remove any line before it is drawn
- Write extra notes for the AI, then fill it again
- Change template before you add it
- Choose the colour and the caption under it
The 15 Infographic Templates
Every template has a title, a small heading above it, a line under it and a sources line.
At a glance
A headline number, the main parts and the steps, for a whole guide.
Options compared
Two to four ways of doing something, each with its facts and steps.
Step by step
A process in order, one step per row.
Timeline
Dated events in order: a history, a career, a launch plan.
Comparison table
Things side by side, feature by feature.
Pros and cons
The case for and against, with a verdict.
Checklist
Things to tick off, in groups.
Key numbers
Big numbers from the article, each with what it means.
Do’s and don’ts
What to do and what to avoid.
Myths vs facts
Common beliefs and what is actually true.
Which is right for you
A question and the answer for each kind of reader.
Top list
A ranked list: best tools, top tips, biggest risks.
Framework
A model with named parts around one idea.
Profile card
A person, product or place: key facts and highlights.
Key terms
A short glossary of the words the article uses.
What Happens When You Add One
| Question | Answer |
|---|---|
| Where does it go? | Under the heading you chose, or after the introduction when it covers the whole article. |
| Where is the file kept? | In your site’s own media library, uploaded like the article’s other pictures. |
| What do screen readers hear? | Alt text naming the template and listing what the infographic says. |
| Does it show a caption? | Only if you add one. It appears under the picture. |
| What does it cost? | 1 credit from your monthly credits, like any extra picture. |
| What if the post is already live? | The article is marked so you can send the change with Update live post. |
An Infographic on a Live Post
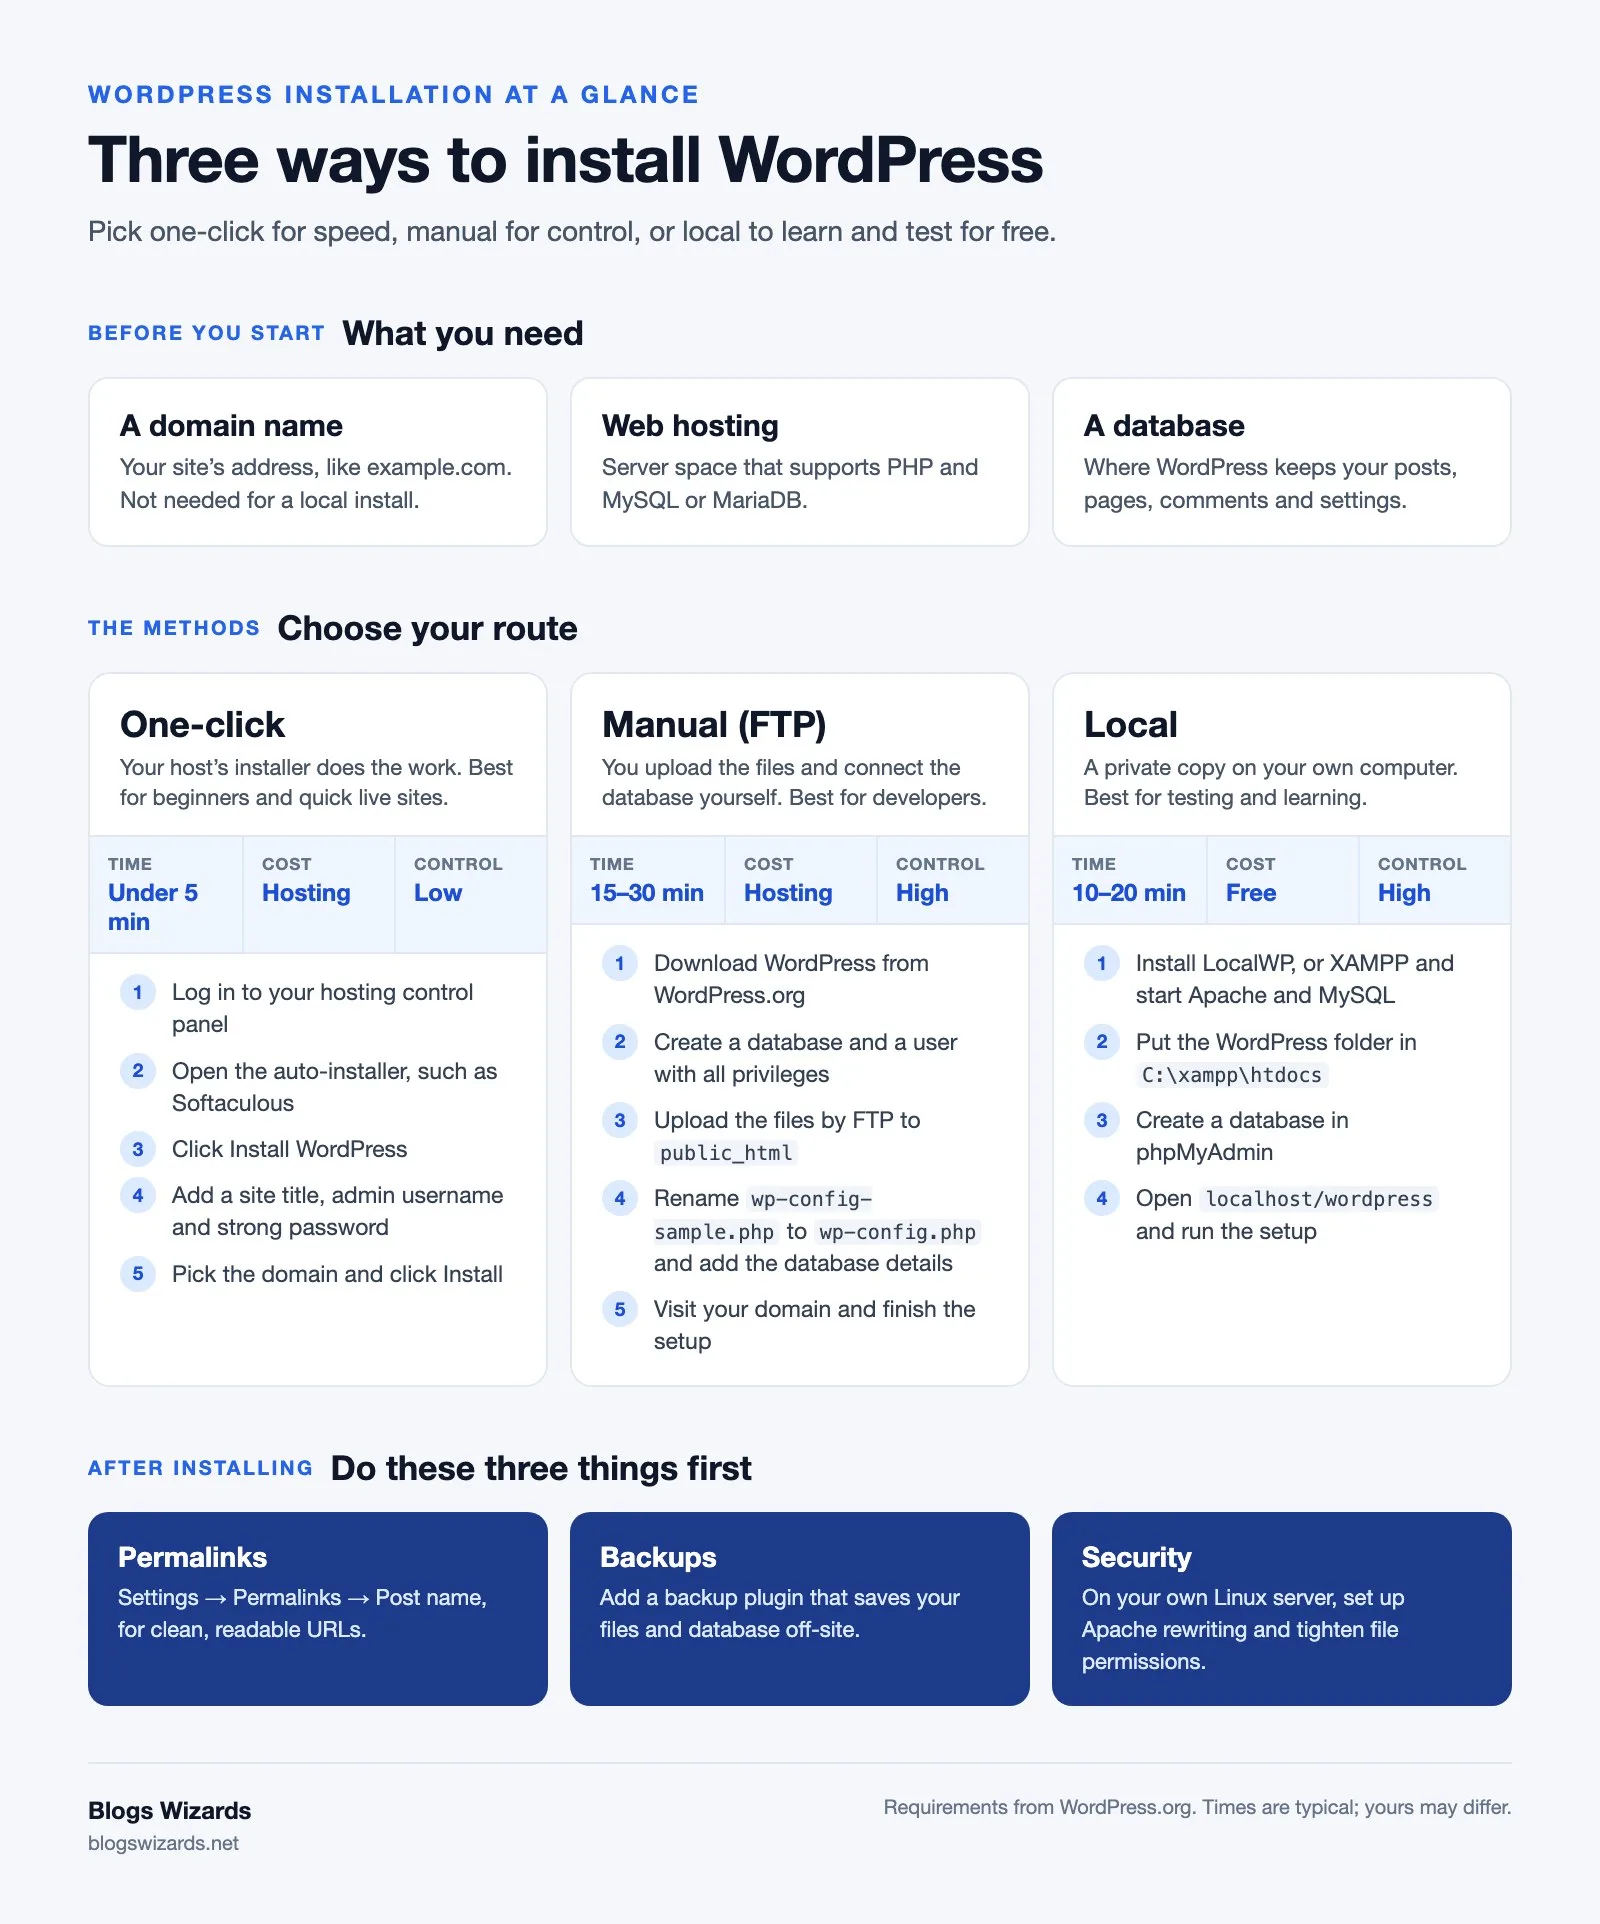
Blogs Wizards, one of our own sites, carries this infographic in its guide to installing WordPress, under the section on what you need first.
A Second Example, From a Tech Site
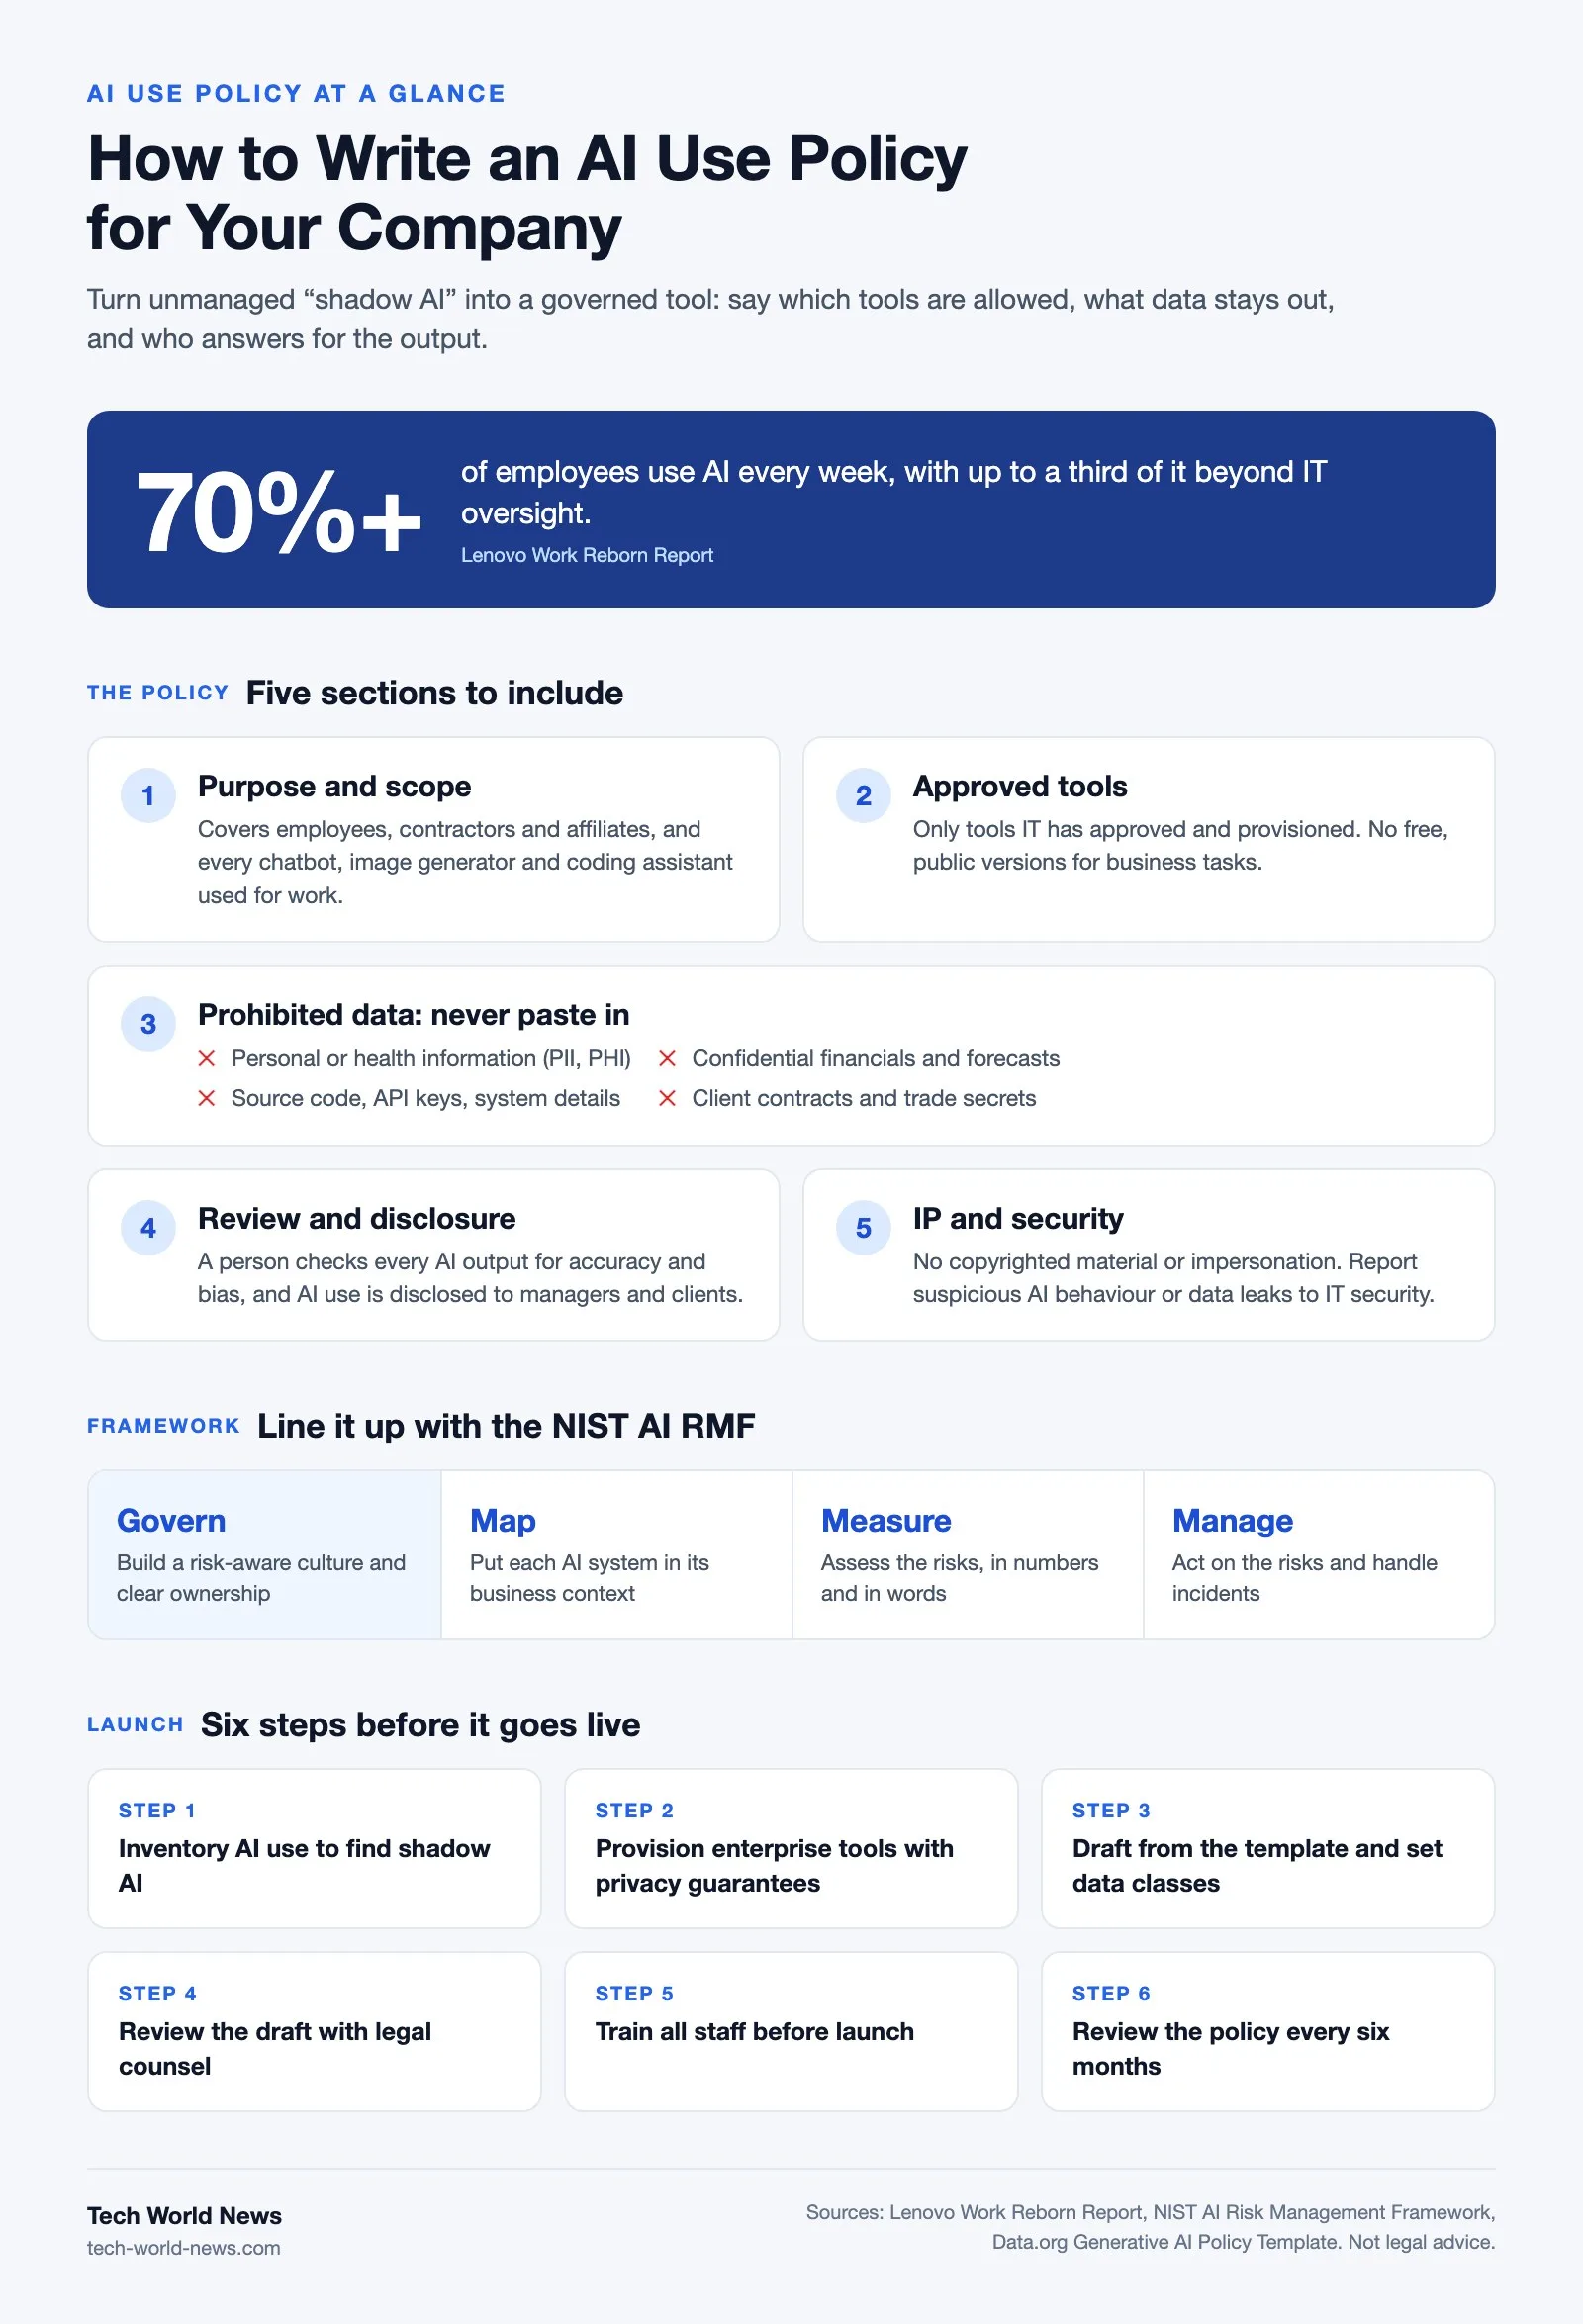
Tech World News, another of our sites, uses the at-a-glance style to sum up its guide to writing an AI use policy, with the sources named at the foot.
Infographic Questions
No. Infographics are made on the draft page of an article written or updated in Write & Grow, from that article or one of its sections.
Every number is compared with the article. Any it can’t find is listed as “Not in the article”, and you decide whether to check it or take it out.
You choose from 15 templates and six colours, and edit every line of text. The layout of each template is fixed, so it stays readable at any size.
1 credit, the same as any extra picture. An article uses 10 or 15. See pricing for each plan’s credits.
Yes. Once it is added, the draft is marked out of date, and Update live post sends the new version to your site.
Any connected site that takes image uploads, such as WordPress, Ghost and Wix. If a site’s platform can’t take uploads, you see a message and nothing is used from your plan.
Free to set up
Start Growing Your Site With Articles You Can Trust.
Connect your WordPress site and add your sources for free, then choose a plan when you’re ready to write.